Showing posts with label 3.3 Decision-making techniques. Show all posts

Monday, 29 May 2017

Sales Forecasting


The first bullet point should read 'Quantitative sales forecasting'.

Not as if exam boards ever get anything wrong.


http://www.youtube.com/watch?v=TVblWq3tDwY

What is your definition of 'marketing'?

Marketing

The action or business of promoting and selling products or services, including market research and advertising.

Cadburys has a ‘brand manager’ for each product within its portfolio.
How many different Cadbury products can you think of?


Each brand manager will focus on the likely future sales of the product they are responsible for.

Imagine this was your role for Creme Eggs (with a £60,000 salary, at least.)

What are the implications for Cadbury of a changing sales forecast for the products they make?

A sales forecast will have an impact on:

1. Investment decisions.

2. The number and type of staff that are required.

3. The four Ps (price, product, place & promotion).

Methods of forecasting sales:

For a new product Test Marketing may be used.
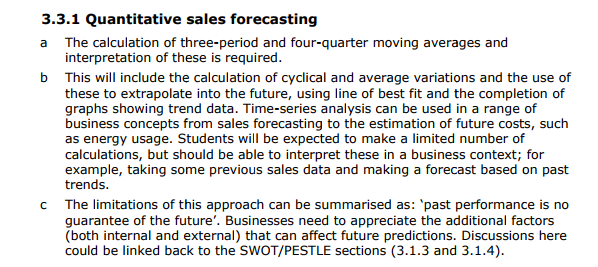


For an existing product a 'moving average' is a good way to smooth out fluctuations in sales to allow for a prediction of future sales. 

This is technically known as time series analysis.

How to calculate a 4 quarter moving average:


Year                       Sales

2006                       125
2007                       130
2008                       130
2009                       150
2010                       140
2011                       155
2012                       180
2013                       190
2014                       210
2015                       230

Calculate a 3 & 4 year moving average.

Drawing a line of best fit:

Limitations of quantitative sales forecasts:

No forecast can be 100% accurate.

Cyclical variations may occur.

Random variations may occur.

The longer the time period of the forecast the more uncertainty there is.

The forecaster should prepare a range of forecasts:

1. Optimistic

2. Pessimistic

3. A central forecast

Qualitative sales forecasting:

This may involve panel surveys (focus groups):

Saturday, 27 May 2017

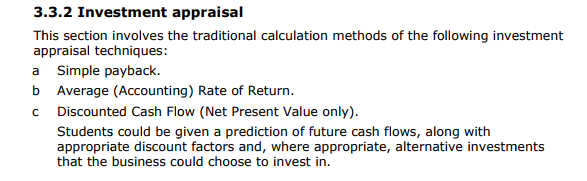
Investment Appraisal


Investment refers to the purchase of capital goods like machinery or a new computer aided design system.

These goods will be used repeatedly over a period of time.

This investment is likely to generate a return in the future.

Investment appraisal describes how a business might objectively evaluate an investment project to determine whether or not it is likely to be profitable.

Investment appraisal allows for a comparison between competing investment options.

Capital cost: the amount of money spent when setting up a new venture.


Net cash flow: cash inflows minus cash outflows.

Payback:
The amount of time it takes for a project to recover or pay back the initial cost.


More details here.

Average (Accounting) Rate of Return (ARR):
This gives a % rate of return.

Formula:
Net return (profit) per annum  x 100
Capital outlay (cost)


More details here.

Discounted cash flow (net present value or NPV):

This takes into account what cash flow or profit earned in the future is worth at the present value.

Money in the future is worth less than the same amount now (the present value).

Discount tables can be used to show by how much a future value must be multiplied to calculate its present value.

Cash flow or profit of £15,000 received in five years time, at a discount rate of 5% would be worth 
£11, 753.

How to calculate NPV and advantages / disadvantages - details here.


Remember...... 


When making any investment appraisal decision qualitative factors should always be considered alongside quantitative factors.

What will be the impact on staff?

Will the quality of the product change?

Are there any ethical issues to consider?

More on investment appraisal here.

Friday, 26 May 2017

Decision Trees


When the outcome of a decision is uncertain, decision trees can be used to help a business reach a decision which could minimise risk and gain the greatest return.

A decision tree is a method of tracing the alternative outcomes of any decision.

Decision trees only work if you have an idea of the probability of an event occurring and the financial result of such events.

A decision tree looks like this:


How does the maths work? Advantages / disadvantages - Details here.

Thursday, 25 May 2017

Critical Path Analysis


Critical path analysis uses network diagrams to identify:

The minimum time needed to complete a project.

Activities on the 'critical path' which cannot be delayed if the project is to finish on time.

Non critical activities.

How it works, advantages and disadvantages - details here.


Total Float time:

The amount of time by which a task can be delayed without causing the project to be delayed.

It can be calculated as:

LFT of activity minus EST of activity minus duration of activity.
The total float is found by subtracting the EST and the duration from the LFT, so for task B it would be 3 (13-4-6), this is the total float up to that activity.


Wednesday, 24 May 2017

3.3 Decision Making Techniques - Questions


Moving averages:

Calculate the 4 quarter moving average.


Investment appraisal:


Decision trees:


Critical Path Analysis – Draw the network.